https://motorimpairment.neura.edu.au/wp-content/uploads/2018/05/jim.jpg
https://motorimpairment.neura.edu.au/wp-content/uploads/2018/05/jim-1.jpg
https://motorimpairment.neura.edu.au/wp-content/uploads/2018/05/Fig-1.tif
https://motorimpairment.neura.edu.au/wp-content/uploads/2018/05/Fig-1-1.tif
https://motorimpairment.neura.edu.au/wp-content/uploads/2018/05/Fig-1-2.tif
https://motorimpairment.neura.edu.au/wp-content/uploads/2018/05/Fig-1-1024x661.jpg
https://motorimpairment.neura.edu.au/wp-content/uploads/2018/05/Fig-1-1-1024x661.jpg
https://motorimpairment.neura.edu.au/wp-content/uploads/2018/05/Fig-1-2-1024x665.jpg
https://motorimpairment.neura.edu.au/wp-content/uploads/2018/05/old-clock-1024x683.jpeg
https://motorimpairment.neura.edu.au/wp-content/uploads/2018/05/cranberry-1297871_960_720.png
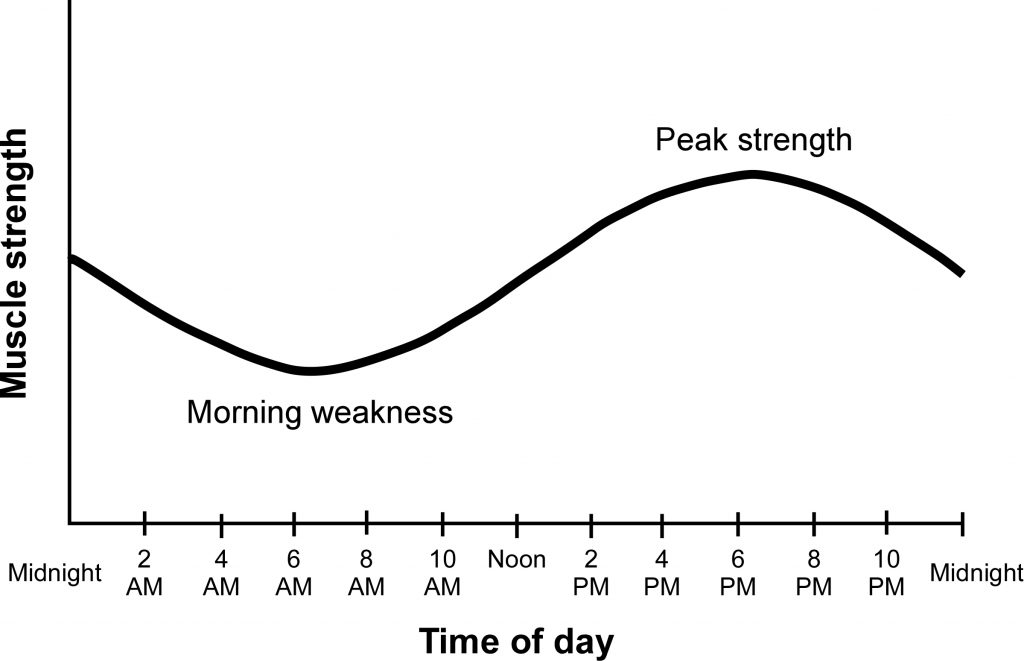
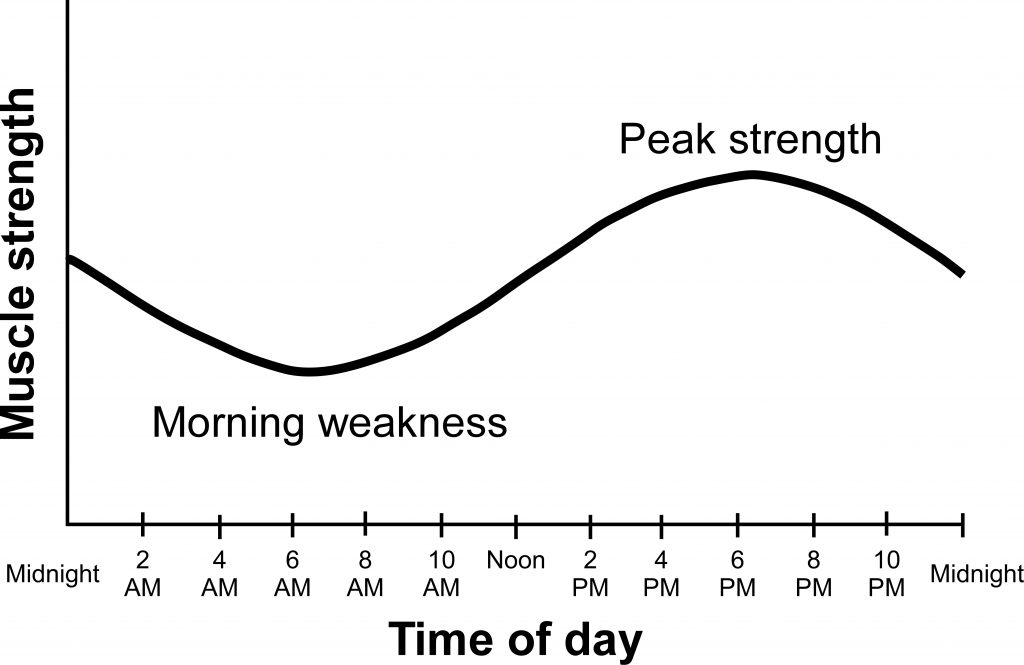
This figure illustrates the sinusoidal relationship often observed between muscle strength and time of day. Data from most studies would not fit precisely on this curve, but in general, muscle strength is lowest in the morning then gradually increases (or is plateaued) throughout the afternoon and early evening, and then decreases thereafter. The magnitude of difference between the lowest and highest parts of the curve is roughly 4 – 10%. This figure has been adapted from Coldwells et al. 2004.